DST Examples

Please Note:

Opportunities in open fund DSTs are restricted to accredited investors in compliance with SEC Regulation D. Public solicitation of these opportunities is prohibited. The examples shown are not available for investment and are intended to give a clearer understanding of what typical DST investments have entailed.

If you are interested in exploring current DST investment opportunities that are compliant with SEC regulations and are suitable for your financial status, we encourage you to contact us. By filling out the "Contact Me" fields or reaching out directly, we can initiate the process of verifying whether you meet the accredited investor criteria. Once verified, our team can offer personalized, consultative services to align with your investment goals, especially if you are considering or are in the midst of a 1031 Exchange.

For any inquiries or to begin the qualification process, please contact us today.

Multifamily

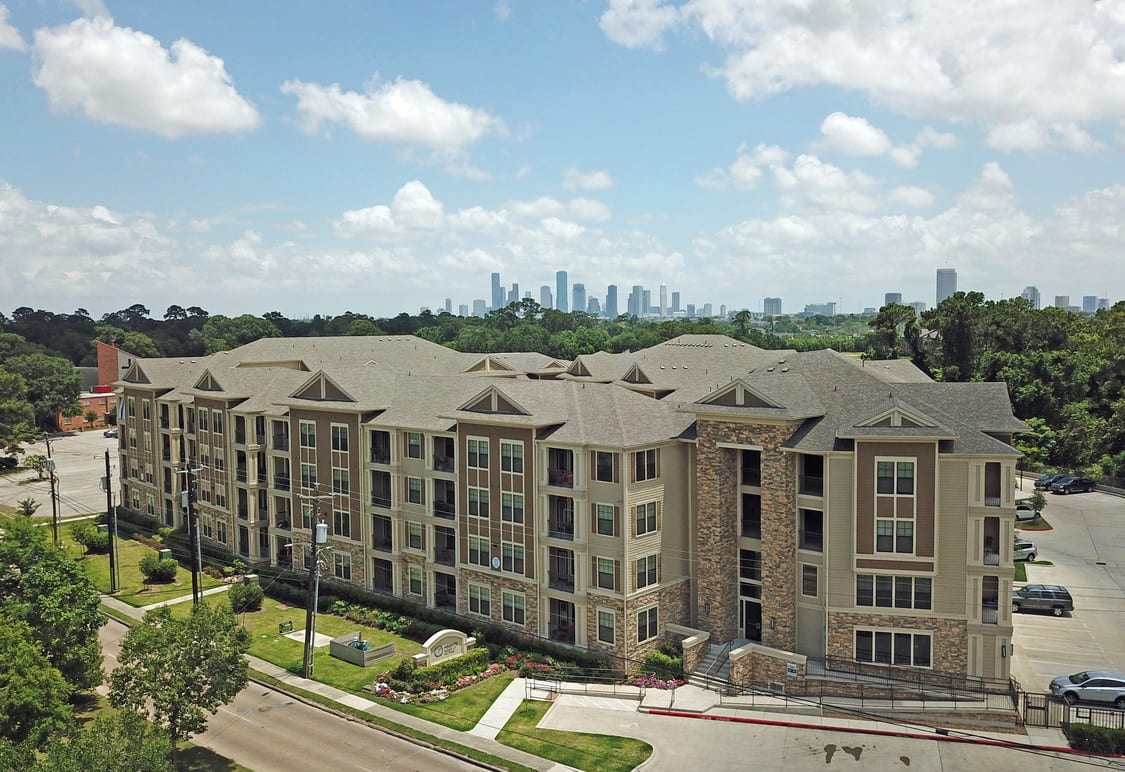
Completed in 2017, Heights West 11th (the “Property”) is a boutique Class-A apartment community uniquely located in the middle of the Heights & Timbergrove neighborhoods of Houston, Texas. The Sponsor believes that the neighborhood is one of the most desirable

Completed in 2017, Heights West 11th (the “Property”) is a boutique Class-A apartment community uniquely located in the middle of the Heights & Timbergrove neighborhoods of Houston, Texas. The Sponsor believes that the neighborhood is one of the most desirable places to live for young professionals and is also proximate to some of Houston’s most vibrant retail and restaurant destinations. The walkability, the abundant mom-and-pop shops, the distinct architecture, and the proximity to downtown all make for, in the Sponsor’s opinion, a living experience unlike any other in Houston

  • LocationPhoenix MSA/ Williamsburg, VA
  • Year Built/Renovated2020, 2021
  • LTV35.79%
  • Property Purchase Price$ 285,890,000
  • Equity from Investors$ 209,327,056
  • Loaded Cap Rate3.12%
  • Year 1 Cash Flow3.10%
  • Acquisition Cap Rate3.56%
  • PPM Date28/06/2022
  • Active OfferingNo
  • Reg D Exemption506(b)
  • Loan$ 116,700,000
  • Investment Cost$ 326,027,056
  • Appraised Value$ 286,000,000
  • Occupancy89.56%
  • No. Units698
  • Per Unit Cost$ 409,585
  • Loaded Per Unit Cost$ 467,097
  • Price Per SF$ 443
  • Avg Rent Per SF$ 1.71
  • Interest Rate2.60%
  • DSCR3.36x
  • Total Expenditures (% of Equity)17.09%
  • Total Expenditures (% of Total Syndication)10.97%
  • Initial Reserves (% of Total Syndication)1.34%
  • Loaded Cap Rate Spread4.37%
  • Residual B/E Cap Rate0.81%
  • Residual Cap Rate Spread

Industrial

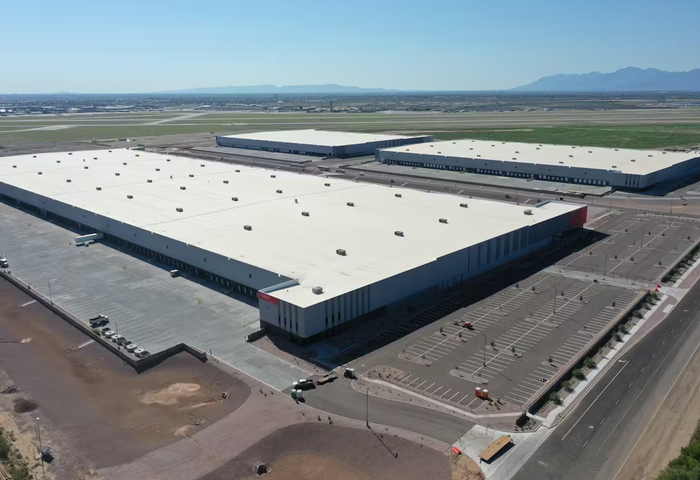
Newly constructed Class A warehouse totaling 1.2M SF in Glendale, Arizona, just outside of Phoenix. The Property is 100% leased to Williams Sonoma through 2037. Phoenix has experienced significant population growth the last 10+ years compared to the national average,

Newly constructed Class A warehouse totaling 1.2M SF in Glendale, Arizona, just outside of Phoenix. The Property is 100% leased to Williams Sonoma through 2037. Phoenix has experienced significant population growth the last 10+ years compared to the national average, driving demand for industrial space. The vacancy rate in the market was below 4% at the end of 2021. The Property features Class A specifications including 40’ clear heights, cross-dock loading, extensive car parking, 2 access points, 213 loading docks, and 190’ concrete truck courts on the north and south sides of the building.

  • LocationPhoenix MSA/ Williamsburg, VA
  • Year Built/Renovated2020, 2021
  • LTV35.79%
  • Property Purchase Price$ 285,890,000
  • Equity from Investors$ 209,327,056
  • Loaded Cap Rate3.12%
  • Year 1 Cash Flow3.10%
  • Acquisition Cap Rate3.56%
  • PPM Date28/06/2022
  • Active OfferingNo
  • Reg D Exemption506(b)
  • Loan$ 116,700,000
  • Investment Cost$ 326,027,056
  • Appraised Value$ 286,000,000
  • Occupancy89.56%
  • No. Units698
  • Per Unit Cost$ 409,585
  • Loaded Per Unit Cost$ 467,097
  • Price Per SF$ 443
  • Avg Rent Per SF$ 1.71
  • Interest Rate2.60%
  • DSCR3.36x
  • Total Expenditures (% of Equity)17.09%
  • Total Expenditures (% of Total Syndication)10.97%
  • Initial Reserves (% of Total Syndication)1.34%
  • Loaded Cap Rate Spread4.37%
  • Residual B/E Cap Rate0.81%
  • Residual Cap Rate Spread

Industrial

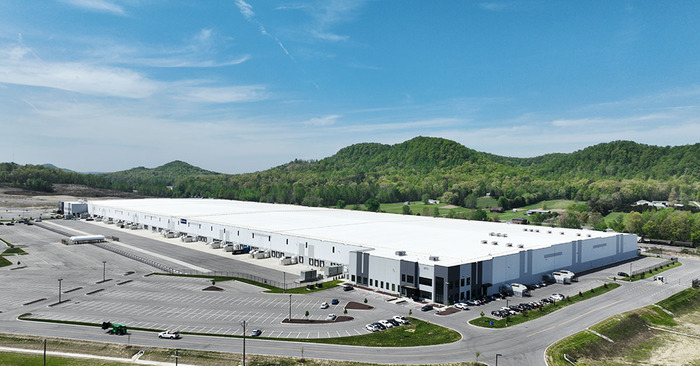
Newly constructed Class-A distribution center totaling approximately 1M square feet in the south Louisville, KY market. Louisville’s central geographic location, transportation infrastructure and strong interstate access makes it a highly desirable and strategic location for both regional and national logistics.

Newly constructed Class-A distribution center totaling approximately 1M square feet in the south Louisville, KY market. Louisville’s central geographic location, transportation infrastructure and strong interstate access makes it a highly desirable and strategic location for both regional and national logistics. State-of-the-art, cross dock distribution center featuring 40-foot clear heights, with significant investment by its tenant, UPS Supply Chain Solutions. The property fits well within JLL Income Property Trust’s industrial investment strategy focused on institutional-quality core assets located in close proximity to irreplaceable hubs of transportation.

  • LocationPhoenix MSA/ Williamsburg, VA
  • Year Built/Renovated2020, 2021
  • LTV35.79%
  • Property Purchase Price$ 285,890,000
  • Equity from Investors$ 209,327,056
  • Loaded Cap Rate3.12%
  • Year 1 Cash Flow3.10%
  • Acquisition Cap Rate3.56%
  • PPM Date28/06/2022
  • Active OfferingNo
  • Reg D Exemption506(b)
  • Loan$ 116,700,000
  • Investment Cost$ 326,027,056
  • Appraised Value$ 286,000,000
  • Occupancy89.56%
  • No. Units698
  • Per Unit Cost$ 409,585
  • Loaded Per Unit Cost$ 467,097
  • Price Per SF$ 443
  • Avg Rent Per SF$ 1.71
  • Interest Rate2.60%
  • DSCR3.36x
  • Total Expenditures (% of Equity)17.09%
  • Total Expenditures (% of Total Syndication)10.97%
  • Initial Reserves (% of Total Syndication)1.34%
  • Loaded Cap Rate Spread4.37%
  • Residual B/E Cap Rate0.81%
  • Residual Cap Rate Spread

Medical Office/ R&D

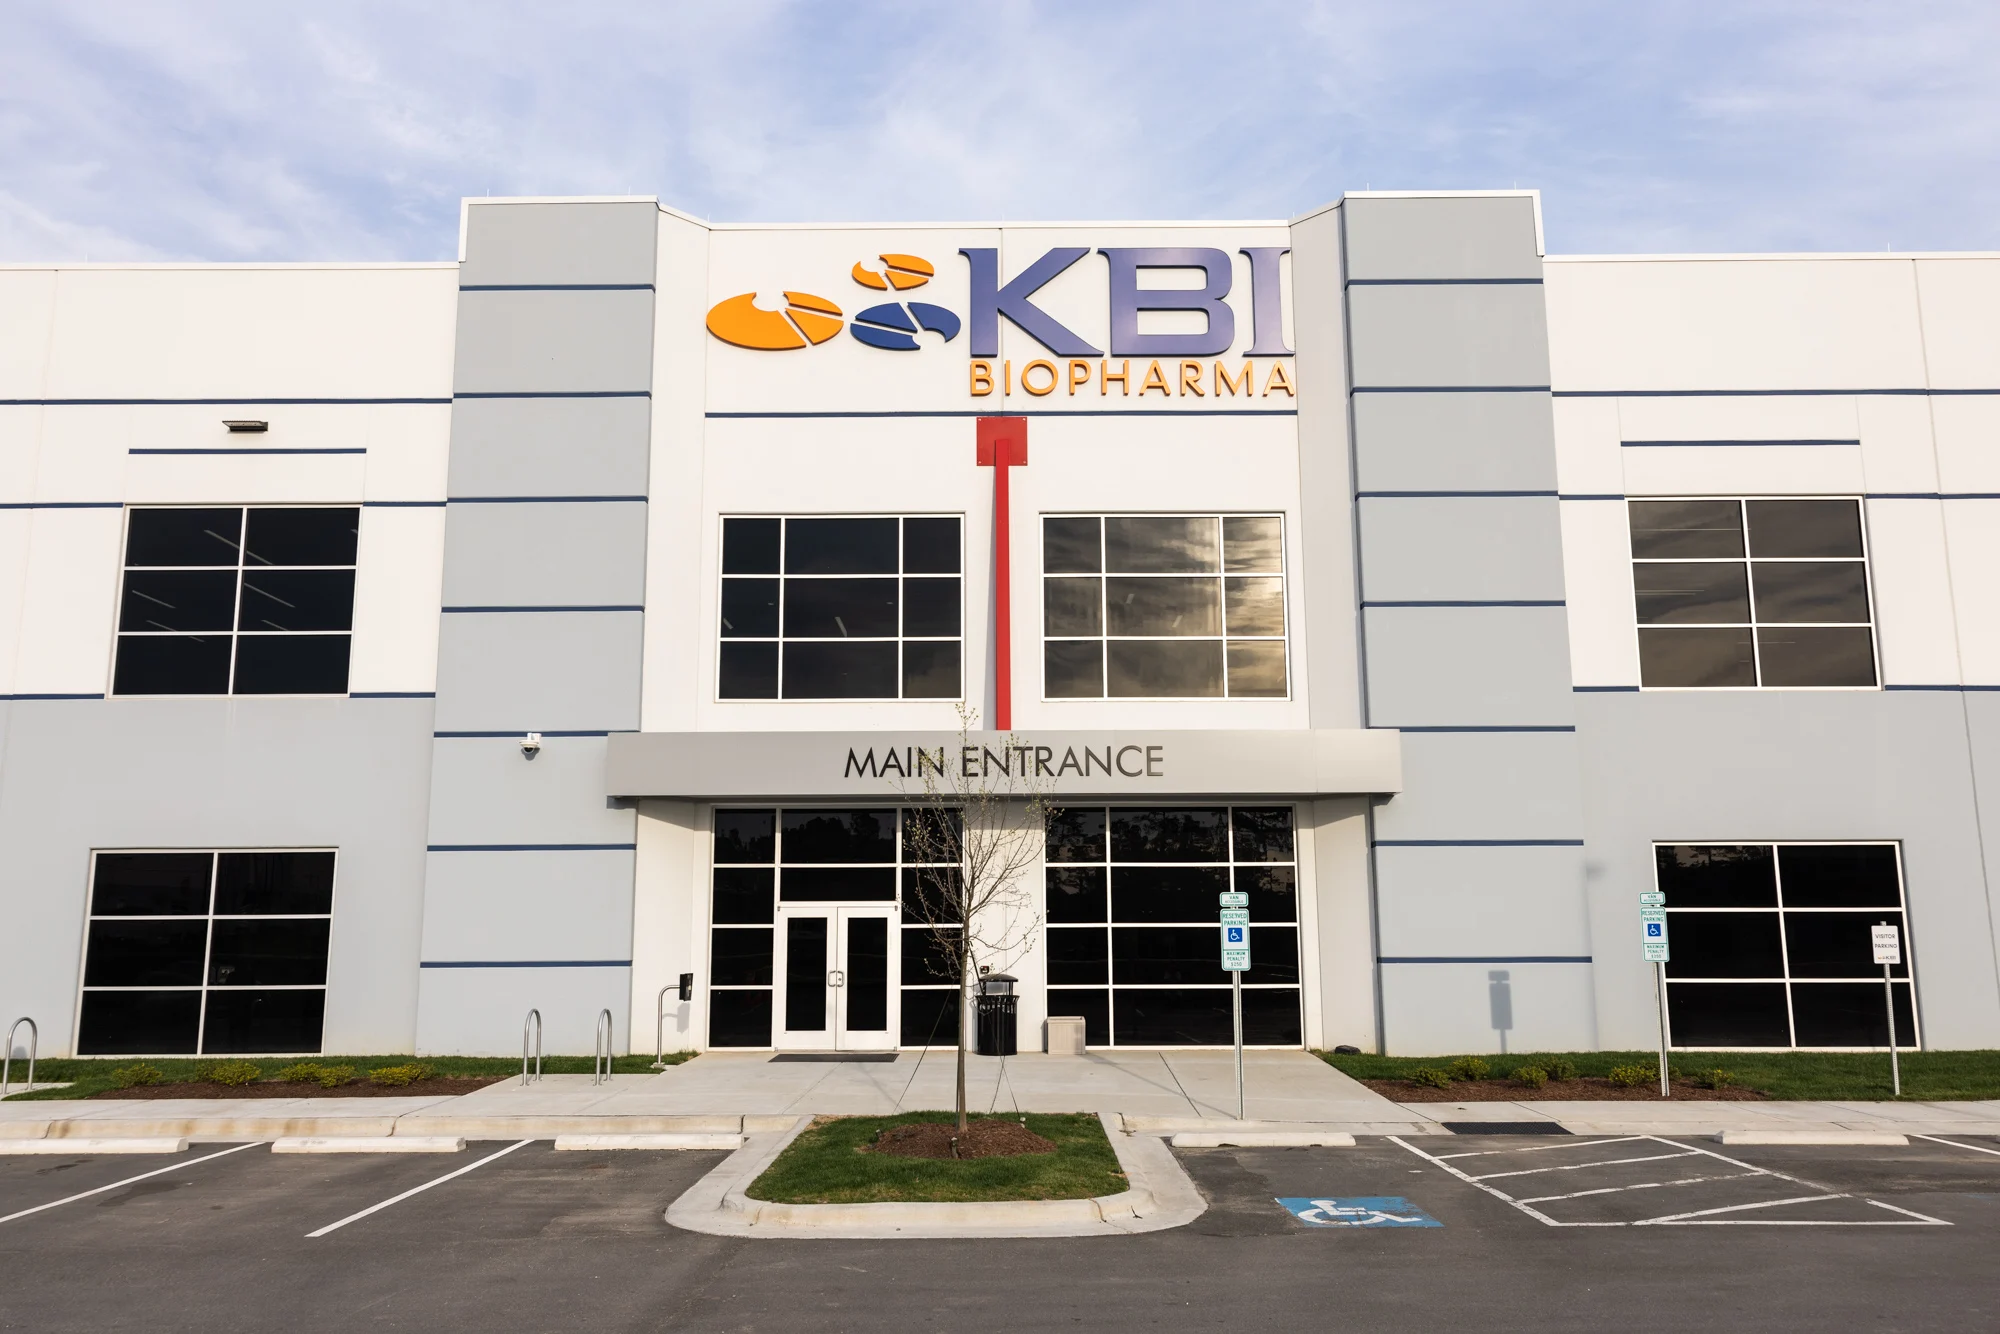
The Property: 47 National Property The Trust owns the 47 National Property consisting of real estate and improvements located at 47 National Way, Durham, North Carolina 27703, commonly known as “47 National Way.” Developed in 2020, the 47 National Property

The Property: 47 National Property The Trust owns the 47 National Property consisting of real estate and improvements located at 47 National Way, Durham, North Carolina 27703, commonly known as “47 National Way.” Developed in 2020, the 47 National Property consists of a one- story building that contains approximately 32.31 acres of land, approximately 187,312 net rentable square feet of industrial warehouse space, and 189 parking spaces. As of June 30, 2023, the 47 National Property is 100% leased and occupied by the sole end tenant, KBI Biopharma, Inc., a Delaware corporation, (“KBI”). 2nd Property: 140 Park Property The Trust owns the 140 Park Property consisting of real estate and improvements located at 140 Park Avenue, Florham Park, New Jersey 07932, commonly known as “140 Park Avenue.” Completed in 2015, the 140 Park Property consists of a single four-story building situated on approximately 6.642 acres of land that contains 100,705 net rentable square feet of retail commercial space and 538 parking spaces. The 140 Park Property is 100% leased by the sole end tenant, Summit Health Management, LLC, a New Jersey limited liability company (“Summit”), who in turn subleases portions of the 140 Park Property to its affiliates.

  • LocationPhoenix MSA/ Williamsburg, VA
  • Year Built/Renovated2020, 2021
  • LTV35.79%
  • Property Purchase Price$ 285,890,000
  • Equity from Investors$ 209,327,056
  • Loaded Cap Rate3.12%
  • Year 1 Cash Flow3.10%
  • Acquisition Cap Rate3.56%
  • PPM Date28/06/2022
  • Active OfferingNo
  • Reg D Exemption506(b)
  • Loan$ 116,700,000
  • Investment Cost$ 326,027,056
  • Appraised Value$ 286,000,000
  • Occupancy89.56%
  • No. Units698
  • Per Unit Cost$ 409,585
  • Loaded Per Unit Cost$ 467,097
  • Price Per SF$ 443
  • Avg Rent Per SF$ 1.71
  • Interest Rate2.60%
  • DSCR3.36x
  • Total Expenditures (% of Equity)17.09%
  • Total Expenditures (% of Total Syndication)10.97%
  • Initial Reserves (% of Total Syndication)1.34%
  • Loaded Cap Rate Spread4.37%
  • Residual B/E Cap Rate0.81%
  • Residual Cap Rate Spread

Life Science

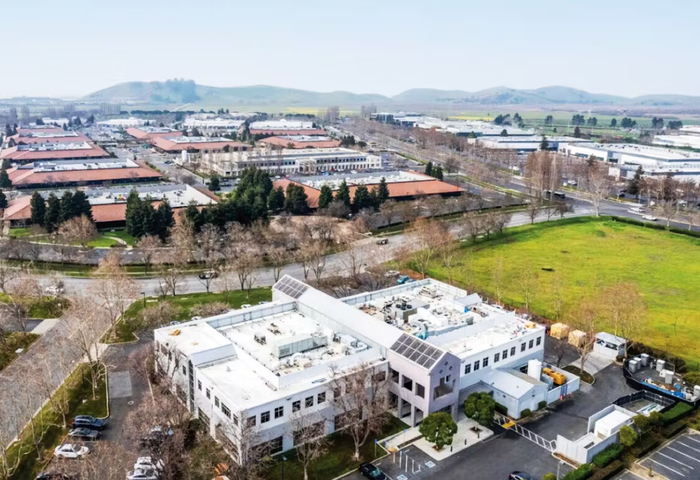
The properties consist of two life science/R&D buildings located in the Ardenwood submarket of Fremont, California. The properties are 100% leased to three tenants that focus on life sciences, medical devices and electronics R&D, with a weighted average lease term

The properties consist of two life science/R&D buildings located in the Ardenwood submarket of Fremont, California. The properties are 100% leased to three tenants that focus on life sciences, medical devices and electronics R&D, with a weighted average lease term of 7.3 years. The San Francisco Bay Area is the #2 life science market in the US by SF and #1 for “Innovation Score.” The market has realized tremendous job growth that is projected to continue into the future. Demand for space in the area has been spurred by a combination of $20B in Bay Area VC investment in 2021 and a robust cluster of nearby research institutions. The pandemic has increased both consumer and investor interest in life sciences research.

  • LocationPhoenix MSA/ Williamsburg, VA
  • Year Built/Renovated2020, 2021
  • LTV35.79%
  • Property Purchase Price$ 285,890,000
  • Equity from Investors$ 209,327,056
  • Loaded Cap Rate3.12%
  • Year 1 Cash Flow3.10%
  • Acquisition Cap Rate3.56%
  • PPM Date28/06/2022
  • Active OfferingNo
  • Reg D Exemption506(b)
  • Loan$ 116,700,000
  • Investment Cost$ 326,027,056
  • Appraised Value$ 286,000,000
  • Occupancy89.56%
  • No. Units698
  • Per Unit Cost$ 409,585
  • Loaded Per Unit Cost$ 467,097
  • Price Per SF$ 443
  • Avg Rent Per SF$ 1.71
  • Interest Rate2.60%
  • DSCR3.36x
  • Total Expenditures (% of Equity)17.09%
  • Total Expenditures (% of Total Syndication)10.97%
  • Initial Reserves (% of Total Syndication)1.34%
  • Loaded Cap Rate Spread4.37%
  • Residual B/E Cap Rate0.81%
  • Residual Cap Rate Spread

Self-Storage

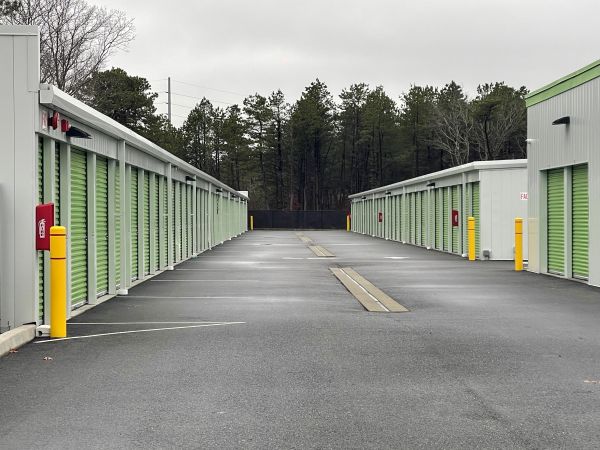
This offering consists of two self-storage properties totaling 1,492 units located in Walpole, MA, and Yaphank, NY. The properties are operated by Devon Self Storage Holdings (US) LLC under the Devon name and brand.

This offering consists of two self-storage properties totaling 1,492 units located in Walpole, MA, and Yaphank, NY. The properties are operated by Devon Self Storage Holdings (US) LLC under the Devon name and brand.

  • LocationPhoenix MSA/ Williamsburg, VA
  • Year Built/Renovated2020, 2021
  • LTV35.79%
  • Property Purchase Price$ 285,890,000
  • Equity from Investors$ 209,327,056
  • Loaded Cap Rate3.12%
  • Year 1 Cash Flow3.10%
  • Acquisition Cap Rate3.56%
  • PPM Date28/06/2022
  • Active OfferingNo
  • Reg D Exemption506(b)
  • Loan$ 116,700,000
  • Investment Cost$ 326,027,056
  • Appraised Value$ 286,000,000
  • Occupancy89.56%
  • No. Units698
  • Per Unit Cost$ 409,585
  • Loaded Per Unit Cost$ 467,097
  • Price Per SF$ 443
  • Avg Rent Per SF$ 1.71
  • Interest Rate2.60%
  • DSCR3.36x
  • Total Expenditures (% of Equity)17.09%
  • Total Expenditures (% of Total Syndication)10.97%
  • Initial Reserves (% of Total Syndication)1.34%
  • Loaded Cap Rate Spread4.37%
  • Residual B/E Cap Rate0.81%
  • Residual Cap Rate Spread

Listing Type

DST

FULY FUNDED

Location

Investment Type: Multi-Family
First year projected lease payment as percentage of invested capital
(Cash on Cash): 
4%
Fully Syndicated Value:
 $43,925,000
Equity Remaining: Fully Funded
Loan Amount: $24,375,000
Hold Period: 7-10 year
Total Equity/Beneficial Interests: $15,673,000
LTV: 55.49%
Occupancy: 91.25%
Minimum purchase 1031: $100,000; Accredited

Request Query